Total Pageviews

Monday, August 27, 2012

Haplogroup Tree J1 STR67

Today, I want to present haplogroup J1 tree with STR67 data. I used the same method as before. The goal was to get a tree for the oldest branches of the J1 haplogroup.
To do so I only used individuals that are labeled as J1 (not J1c, J1b, etc.) at FTDNA. In a lot of cases SNPs downstream of J1 were not tested, so I had to help myself: I excluded all individuals that show high similarity with known J1c and J1b individuals. Then, I generated the first tree with 200 individuals.

Polar tree of haplogroup J1 (excluding known J1b and J1c individuals):

J1 is split into two parts: the Arabian Peninsula (highlighted in magenta) and the rest. My assumption is that all these individuals from the Arabian Peninsula have the haplogroup J1c3d2 L222.2+ or at least J1c but they were just not tested for it.

Next, I excluded those individuals, I repeated the analysis with the remaining individuals.

1. Rectangular tree of haplogroup J1:


2. Polar tree of haplogroup J1:


Note:
The individuals from Iran (Irn-187962), Iraq (Irq--92829) and Turkey (Tur-191398,  Aintab, Turkey) are Assyrians. All other individuals from Iran and most individuals from Turkey (Tur-...) are actually Armenians. Unfortunately, no known Kurd is included in this analysis but based on the names there is one individual from Turkey (Tur-221845, Ahmed) that is Muslim and thus, not an Armenian or Assyrian, so he could be a Kurd.

Resume:
The oldest branches of haplogroup J1 can be found in Northern Mesopotamia and Eastern Anatolia. 


Friday, August 24, 2012

Haplogroup J1 tree STR111

Edit 09/12/2012:
I updated this post to make it shorter/easier for readers.

Today, I want to present the haplogroup J1 tree with STR111 data. I used the same method as before. Most of the individuals in this tree are from the Arabian peninsula and have the haplogroup J1b2b1 (aka J1c3d2) L222.2+. Some of them did not test for L222.2 but I am pretty confident about this. Based on the tree I predicted the haplogroups of some others.

Unfortunately, there is no Kurdish data included in this tree but we can assume that most Kurds with J1 belong to the same subclade as their closest neighbors, i.e. J1* M267. Of course, this has to be confirmed.

Actually, one individual in this figure is definitely from Iraqi Kurdistan: Irq---92829 is an Assyrian of Erbil :-)

I know of one Kurd of Sharif descent that is J1b2b. Unfortunately, he has only STR67 analyzed, so I cannot include him in the STR111 trees presented below. However, he is grouped with 100329 (unknown origin) and M4284 (from UAE) in the FTDNA J Haplogroup Project, so he would be close to these in the tree, and both 100329 and M4284 are at the root of the very large J1b2b branch (The previous name of J1b2b was J1c3d; at 23andme it is called J1e; details about the name changes can be found at ISOGG).

Color code:
J1 M267 Z1834-, Z1842- grey ("oldest" branch)
J1 M267 Z1842+ light blue
J1a M365.1 red (only one individual: Antonio Gomes 1635, Milhazes, Barcelos, Portugal [Por---73612]) 
J1b* L136  light green
J1b2* P58 dark green (clover)
J1b2b* L147.1 blue
J1b2b* Jewish Cohanim Cluster orange
J1b2b*  L859+ yellow
J1b2b1 L222.2+ purple    


Here are the results.
Rectangular tree of J1 (as jpg and as pdf):


Polar tree of J1 (as jpg and as pdf):

Based on this STR111-based tree the history of J1 is much clearer. 

1. The ancestral region of J1 is Caucasus, Northern Mesopotamia or Eastern Anatolia.
2. There is an early split of J1 into two branches.


Edit 09/24/12:
Rob1 (eng.molgen.org user) helped me collecting more J1 STR111 data. The new tree has a total of 313 users (see below). Three Jewish clusters emerged in the STR tree, all three clusters are highlighted in light orange, orange, and dark orange. Arab clusters within the blue J1b2b* L147.1 area are highlighted in light brown, brown, dark brown, and asparagus green. The greenish Arab cluster is at the root of the J1b2b1 L222.2+ purple cluster. The most obvious cluster within the J1b2b1 L222.2+ purple cluster is Bany Zaid cluster (highlighted in red).

Edit 09/30/12:
Iyyovi (eng.molgen.org user) asked me to upload pdf versions of the latest J1 rectangular and polar tree.
pdf polar tree
pdf rectangular tree

Thursday, August 23, 2012

Haplogroup J2 tree STR111

Today, I want to present the haplogroup J2 tree with STR111 data. I used the same method as before (The annotation is not ready...)

Here are the results.

1. Rectangular tree of haplogroup J2:

2. Polar tree of haplogroup J2:
Edit:
A better J2 tree.

Tuesday, August 21, 2012

Whole Genome Comparison: Kurds Part II

 I recently saw the ACD tool (ACD=Ancestral Component Dissection) at Vaêdhya. Unfortunately, I was not able to download it, but I could see the logic behind it by looking at the presented figures. What he did was:
1. Taking several populations from one region and assuming only one main ancestry for all of them.
2. Taking the lowest percentage of each component (Dodecad, Harappa or Eurogenes) and declaring this lowest percentage as ancestral.
3. Subtracting the actual percentage of a component of a population from the lowest percentage.

Example with the Baloch component in Harappa Project:
Step 1:
Armenian: 18%
Assyrian:  19%
Kurd: 26 %
Iranian: 27 %
Step 2:
Lowest Percentage for the Baloch component in these four populations: 18%
Step 3:
Armenian: 18% - 18% = 0 %
Assyrian:  19% - 18% = 1 %
Kurd: 26% - 18% = 8 %
Iranian: 27% - 18% = 9 %

His goal is to measure the influx migration from outside. This measurement is based on the assumption of an ancestral population for all compared populations. Let's see how this ancestral population would look like:

The minimum values of the 12 components for Armenians, Assyrians, Kurds and Iranians are:
S Indian         0%
Baloch         18%
Caucasian    42%
NE Euro        1%
SE Asian       0%
Siberian         0%
NE Asian       0%
Papuan           0%
American       0%
Beringian       0%
Medit.            5%
SW Asian    11%
San                0%
E African      0%
Pygmy          0%
W African    0%
Total           77%

Let's bring up the numbers to a total of 100% :
S Indian        0%
Baloch        23%
Caucasian   55%
NE Euro       1%
SE Asian      0%
Siberian        0%
NE Asian      0%
Papuan          0%
American      0%
Beringian      0%
Medit.           6%
SW Asian    14%
San                0%
E African      0%
Pygmy          0%
W African    0%
Total         100%

In short:
#PopulationPercent
1 Caucasian 55
2 Baloch 23
3 SW-Asian 14
4 Mediterranean 6
5 NE-Euro 1

The main drawbacks of this approach are that ...
1. The calculation is based on processing of already processed data, so the error is getting bigger. It is not directly based on raw data.
2. It is based on the assumption that neighboring people with different histories/languages/religions have one main common ancestry.


I actually used a similar approach here but I did not use averages of populations and I did not assume a common ancestry for these populations. Instead I only focused on results of individuals of only one population. My goal was not to see differences but to see similarities. Onur critized that my old approach was not based on admixture results of others and not on raw data.


So, what I now did was to take all Kurdish raw data and fuse them into one genome. This genome is based on the allele frequencies in Kurds results that I presented here. Allele frequencies of 25-75% were considered as heterozygous and allele frequencies below 25% and above 75% were considered as homozygous.

Then, I used this fused Kurdish genome and ran it through HarappaWorld, Dodecad K12b, and Eurogenes K12.

Interestingly, the Harappa results of the fused Kurdish genome are not far away from the results above:

HarappaWorld for fused Kurdish genome (N=16):

#PopulationPercent
1 Caucasian 54.63
2 Baloch 28.84
3 SW-Asian 12.61
4 Mediterranean 2.85
5 NE-Euro 1.07


Closest populations to this fused Kurdish genome (N=16):

Single Population Sharing:


#Population (source)Distance
1 kurd (yunusbayev) 9.97
2 kurd (xing) 10.36
3 assyrian (harappa) 11.41
4 armenian (yunusbayev) 11.69
5 kurd (harappa) 12.08
6 azerbaijan-jew (behar) 12.29
7 armenian (behar) 12.83
8 iranian (harappa) 12.93
9 uzbekistan-jew (behar) 13.06
10 georgian (harappa) 13.52
11 iranian-jew (behar) 13.91
12 iraqi-mandaean (harappa) 14
13 georgia-jew (behar) 14.49
14 azeri (harappa) 14.62
15 iranian (behar) 15.3
16 turkish (harappa) 16.27
17 iraq-jew (behar) 16.47
18 turk (behar) 17.64
19 turk-kayseri (hodoglugil) 18.51
20 kumyk (yunusbayev) 19.35


Dodecad K12b for fused Kurdish genome (N=16):

#PopulationPercent
1 Caucasus 52.25
2 Gedrosia 29.22
3 Southwest_Asian 12
4 Atlantic_Med 4.18
5 North_European 2.35

Single Population Sharing:


#Population (source)Distance
1 Kurds (Yunusbayev) 10.3
2 Kurd (Dodecad) 11.48
3 Armenians_15 (Yunusbayev) 11.7
4 Iranian (Dodecad) 11.95
5 Azerbaijan_Jews (Behar) 12.09
6 Uzbekistan_Jews (Behar) 12.59
7 Assyrian (Dodecad) 13.02
8 Armenian (Dodecad) 13.25
9 Georgia_Jews (Behar) 13.38
10 Iranian_Jews (Behar) 14.49
11 Iranians (Behar) 14.87
12 Armenians (Behar) 15.19
13 Turks (Behar) 16.88
14 Iraq_Jews (Behar) 17.74
15 Turkish (Dodecad) 19.37
16 Kumyks (Yunusbayev) 20.68
17 Druze (HGDP) 23.08
18 Adygei (HGDP) 23.34
19 Lezgins (Behar) 23.49
20 Chechens (Yunusbayev) 23.62


Eurogenes K12b for fused Kurdish genome (N=16):


#PopulationPercent
1 Caucasus 45.67
2 W-Central Asian 22.79
3 Mediterranean 19.29
4 Southwest Asian 11.81
5 North European 0.45


Sunday, August 19, 2012

I2a2a*-M233 (old I2b1*) comparison STR111

Today, I want the present the calculated tree of I2a2a*-M233 (old I2b1*) using the same approach as before, 10 randomized runs to improve the tree.
Quiet frankly, the result of the M233 STR111 analysis is disillusioning and disappointing. None of the subbranches shows clustering in the tree, all subbranches are overlapping. So based on STR111 values nothing (at least within M233) can be predicted, maybe in the future with more M233 individuals having STR111 tested.

Anyways, I want to share the current results:


Saturday, August 18, 2012

R1a1a comparison STR111 Part II

First of all, I want to thank Humata, the blogger from http://vaedhya.blogspot.com/. He helped me analyzing R1a1a; I used the same tools that he used to analyze haplogroup Q in his recent post.

So, with Humata's help I analyzed all R1a1a individuals that have STR111 data. Again, I used adjusted distances to perform this analysis, which I described and used  here and here.

In order to analyze the data I had to increase IDs to 10 digits to prevent malfunction of the used software Fitch.

There are various versions to illustrate the data. Here, I am presenting two layouts.

Rectangular tree layout (see high resolution image):


Polar tree layout (see high resolution image):


Again, to better see "what is what" I annotate each ID with the proposed group used in the R1a1a and Subclades Project at FTDNA, and I used the same colors for the subclades as in this figure from FTDNA. Even with 111 STR values the main R1a1a SNPs (Z93, Z283, etc.) are overlapping.

So what does give more accurate results, unrooted network analysis or rooted tree analysis?

It is quiet obvious that even STR111 data are not sufficient enough to differentiate between the major R1a1a subclades. There are multiple overlapping haplogroups in the tree (presented below) and in the network (presented previously), i.e. Z283 and Z93 are overlapping when focusing only on the STR111 data. All previously presented trees are adding SNP information to the tree to correct this obvious overlapping. As an example: 
179005     Krikor Mirijanian, Arapkir, Turkey who is Z93+, L342+, L657-. 

Based on his STR111 values 179005 is closest to Z283+, Z280+ and Z283+, Z284+ individuals and not to other Z93+ individuals.


Update:
After Semargl was asked how he generated his R1a1a STR111 tree and why his tree shows clear clusters along the SNP branches, he responded that he is using not only STR but also SNP information to generate the tree.  Additionally, his current phylogenetic tree is a cladogram, that means that the cladogram tree does not have any information about the age or diversity of the R1a1a branches, e.g. the Ashkenazi-Jewish Z93+, L342+, L657- cluster and the MacDonald cluster takes a large part of the tree, even though these clusters are known to be very narrow (low diversity). Hopefully, he can generate a new tree that includes all this information.


From the Fitch software manual:

In Fitch you can also randomize the input order of the sequences with option "j", jumble. Often the input order of the sequences affects the outcome of the analysis. This can be assessed by randomizing the input order. The program also asks you to specify the number of times you want to randomize the input order of the sequences. It is advisable to do jumbling at least 10 times, because it almost certainly improves the results.

This is why I repeated the analysis with 10 runs as advised. Indeed, the R1a1a STR111 tree looks a little bit better now.


Rectangular tree layout (see high resolution image):


Polar tree layout (see high resolution image):


One of the new discovered SNPs is Z1282, downstream of L342. It was found in N77532 Sundardas Tulsyan, India. He is in the tree as # "N77532-2C*". Based on the presented tree and the previously presented network analysis #184336 , SAUD ABDUL AZIZ, Qatar would be a good candidate for L1282, too (1844336-2C* in the tree and in the network analysis).
 

Monday, August 13, 2012

R1a1a comparison STR111

Today, I want to present results I got by combining two methods that I used before. The first method is described here and here; the second method is based on SplitsTree that I also used here and here.

I used all R1a1a individuals with STR111 data from the R1a1a and Subclades Project at FTDNA, a total of 203 individuals (and lots of people with unknown SNP status). The two methods don't use any SNP information, so the clusters are enterily based on STR values and the mutation rate of each STR.

Here is the network as a high resolution jpg.


Update:
To better see "what is what" I annotate each ID with the proposed group used in the R1a1a and Subclades Project at FTDNA, and I used the same colors for the subclades as in this figure from FTDNA.


Here is the color-coded network as a high resolution jpg image.


Sunday, August 12, 2012

L342+ comparison STR67

Today, I want to present results I got by combining two methods that I used before. The first method is described here and here; the second method is based on SplitsTree that I also used here and here.

I used all L342+ individuals with at least STR67 data from the R1a1a and Subclades Project at FTDNA, so L657- and L657+ individuals (and lots of people with unknown SNP status).

Here is the network as a jpg. (Update: New results of N101746 are included in jpg link.)
I started to annotate the different clusters and I will finish it soon, still I want to share the current status.

Update:
N101746 (Central&Southwest Asian; India) is in a cluster with:
M6851 (Arabic II; Saudi-Arabia),
M6699 (Arabic II; Unknown),
M6698 (Arabic II; Unknown),
M6853 (Arabic II; Unknown),
197670 (Central&Southwest Asian; India),
M6132 (Central&Southwest Asian; UAE), and
160543 (Central&Southwest Asian; Iraq).
The "Arabic II" individuals are very close to each other, while the "Central&Southwest Asian" individuals in this cluster show more diversity.

This described cluster above is close to another cluster that is very narrow. The follwoing individuals belong to this cluster:
157103 (Arabic; Saudi-Arabia),
160271 (Arabic; Qatar),
162855 (Arabic; Saudi-Arabia),
178907 (Arabic Saudi-Arabia),
178905 (Arabic; Saudi-Arabia),
157621 (Arabic; Saudi-Arabia),
157619 (Arabic; Saudi-Arabia),
M6895 (Arabic; Saudi-Arabia),
178906 (Arabic; Saudi-Arabia),
M7066 (Arabic; Unknown),
M6183 (Arabic; Unknown),
M6679 (Arabic; Unknown),
M6458 (Arabic; Kuwait),
M7013 (Arabic; Kuwait),
M6982 (Arabic; Unknown), and
M6285 (Arabic; Qatar).

Zoom in:


Friday, August 10, 2012

I2a2a*-M233 (old I2b1*) Z161+ found in Kurdish individual

I2a2a*-M233 (old I2b1*) is being seen as an European haplogroup, this is why I was curious about its occurrence in one Kurdish individual and wrote a post about its world wide distribution here.

Finally,  after a long search the Kurdish I2a2a*-M233 (old I2b1*) turned out to be positive for one SNP downstream of M233, he is Z161+. Newly tested SNPs are highlighted in yellow.

1x I2a2a* (old I2b1*; Z161+, L1228-, L1229-, L1230-, L1226-, L699-, L701-, L702-, L703-, L704-, M379-)(Sorani from Sulaymaniyah/Iraq)


The tree presented in the results part of the I2b1/M223 Y-CLAN STUDY shows the details/relationships of the different groups of I2a2a*. The current position of the mentioned Sorani Kurd is highlighted in bold and yellow. Z161 has two branches: L801/Z76 and L623/L147.4, highlighted in green and light blue, respectively.  L801/Z76 is divided into a three subbranches but based on 23andme data we can already exclude two of them because he is negative for Z78 (1.2.1.1.1) and P95 (1.2.1.1.2).

Excluded branches are highlighted in dark grey (based on the SNPs tested individually by FTDNA).
Excluded branches are highlighted in light grey (based on the SNPs tested automatically by 23andme).


1- M223
1.1- L1229* (Roots)
1.1.1- L812* (Roots Group 1a/446 = 8, 438 = 8)
1.1.1.1- L319 (Roots Group 1a/446 = 8, 438 = 8)
1.1.2- L1230 (Roots Group 2a Section 1/446 = 9, 531 = 11)
1.2- Z161
1.2.1- L801
1.2.1.1- Z76* (Cont2a, Cont2b/P95-, Cont2to1, Cont1-X)
1.2.1.1.1- Z78* (Cont1-XX)
1.2.1.1.1.1- L1198 (Cont1, Cont1a)
1.2.1.1.1.1.1- Z190 (Cont1b, Cont1c)
1.2.1.1.1.1.1.1- Z79 (Cont1c1)
1.2.1.1.2- P95 (Cont2b)
1.2.1.1.3- L1201 (Cont2b)
1.2.2- L623, L147.4 (Cont2c)
1.3- L701/L702
1.3.1- P78 (Cont3a)
1.3.1.1- L484 (Cont3a)
1.3.2- L699/L703 (I2b1-XX)
1.3.2.1- L704 (I2b1-XX1)
1.3.2.1.1- L1226 (I2b1-XX1)
1.4- M284*
1.4.1- L1195
1.4.1.1- L1193* (Isles E)
1.4.1.1.2 L1194 (Isles E)
1.4.1.2- L126, L137, L369 (Isles Limbo, Isles Sc)
1.5- L1228 (I2b1-X)
1.5.1- L1227 (I2b1-X)


Allele Frequency database for Kurds - Kurdish ALFRED

In general, frequencies of a lot of SNPs of various populations can be looked up in the "Allele Frequency database" or ALFRED. ALFRED is a good source and I used it here but unfortunately no Kurdish data are included in the ALFRED database. And for a while I was wondering what the Kurdish frequency of certain SNPs in the genome would be. This is why I decided to write an Excel file (xlsx file) to determine the Kurdish frequencies of 930,000 SNPs. Today, I want to share this file. Caution, the file is almost 50 MB large!

In order to type in your SNP of interest you have to type in the ID of the SNP, similar to the "Browse data" website of 23andme here. You can only look up one SNP at a time.

How to use it:
1. Download Excel file here.
2. Type in the ID of the SNP of interest in the cell "C3" of the "Kurdish ALFRED" sheet.
3. You are done.

To give you an idea how the results look like:


Thursday, August 9, 2012

Genetic disorder within different religious and ethnic communities

Most genetic disorder are autosomal recessive, they can be hidden in the genome without causing any severe health problems for generations. Examples are Sickle cell anemia, Cystic fibrosis, Lysosomal acid lipase deficiency, Tay-Sachs disease, Phenylketonuria, Mucopolysaccharidoses, Glycogen storage diseases, Galactosemia.

Two mutated SNPs of the same allele are needed to get the symptoms of these disorders; one is inherited from the mother and one from the father who both act as carriers.

The chance of such an unfortunate coincidence increases if the parents are closely related or if both belong to a relatively small community that practices endogamy and is based on a small founder population. The chance of a genetic disorder can be roughly estimated by the average length of shared DNA segments (IBD=Identical by descent) within a community. 

Recently, Dienekes analyzed a few populations and determined the IBD length within the community (and between different communities, not shown here).

IBD score in cM (centiMorgan):

151    Iraq_Jews
129.3    Druze
115.8    Yemen_Jews
110.5    Bedouin
106.4    Morocco_Jews
106.2    Ashkenazi_D
99.8    Ashkenazy_Jews
91.7    Chechens_Y
91.1    Palestinian
81.3    Lithuanians
79.7    Saudis
72.2    Yemenese
70.2    North_Ossetians_Y
67.4    Moroccans
61.9    Russian
51.9    Adygei
51.2    Lezgins
50    Assyrian_D
49.3    Balkars_Y
46.3    Abhkasians_Y
44    Polish_D
42.9    Georgians
42.6    Ukranians_Y
30.3    North_African_Jews_D
28.9    Sephardic_Jews
27    German_D
26.6    Cypriots
26.5    North_Italian
25.3    Kumyks_Y
24.3    Hungarians_19
22.9    Romanians_14
22.4    French
21.7    Jordanians
21.1    Portuguese_D
20.9    Spaniards
20.9    Bulgarians_Y
20.6    Kurd_D
17    TSI30
15.6    Greek_D
12.5    Armenians_Y
12.4    C_Italian_D
11.9    Iranians_19
10.8    S_Italian_Sicilian_D
10.3    Sicilian_D
9.9    Turks
9.4    Syrians

Tuesday, August 7, 2012

Whole Genome Comparison: Kurds vs closest genetic relatives

Similar to the previous analysis I want to using a rooted network (EqualAngle180) from SplitsTree, but in this analysis I want to include all individuals and population with an adjusted Euclidean distance of <10 towards the Kurd_D reference population of Dodecad K10a. This includes all Kurds, all Iranians and Azeris, most Georgians, a lot of Armenians, some Turks, one Iraqi Arab, and as reference populations Kurd_D, Kurds_Y, Iranian_D, Iranians (Behar), Abchazians_Y and Uzbekistan Jews: a total of 56 data points.
In this graph, the Caucasus people are closest to the root of network; KD001 and a few other Kurds are missing here (they are not part of the Dodecad project). From there the nework splits into two main branches, the left branch is dominated by Amrenians but it also includes the Iraqi Arab, Usbekistan Jews, one Georgian and one Turk and the right branch is dominated by Kurds and Iranians but it also includes two Turks. In the middle two more Turks and one Azeri show up. Interestingly, two of the Kurmanji Kurds (KD002 and KD007) are right at the root of the "Armenian" branch.

Next, I increased the number of tested samples from 56 to 112.

Again, the Caucasus people are closest to the root of network. Now, a 3rd branch in the middle appears that is dominated by Turks. The left branch now includes Assyrians and Georgian Jews.

To get a better view of the results, the same network with the Dodecad IDs.

Sunday, August 5, 2012

Whole Genome Analysis of Kurds (930K SNPs) Part 1

Today, I want to present my first approach to analyze the whole genome of 16 Kurdish participants and their genetic relationships based on 930K SNPs. Others analyzed Kurds, too, but they focused on the SNPs that could be compared to raw data of scientific data. I used all available SNPs from chromosome 1-22. Additionally, measured the distance of two individuals by counting the SNPs that are completely different for both alleles, e.g. AA vs CC or AA vs TT but not AC vs AA. About 6.1% (5.7%-7.3%) of the SNPs between Kurds are completely different.
I visualized these results by using a rooted ReticulateNetwork (EqualAngle180) from SplitsTree.


It is clearly visible that KD011/KD012 and KD10/KD014 are closely related. Interestingly, people from the Dersim region (Alevi Kurmanji and Zaza) are the closest to the root of the network of the Kurds.
As you can see the other differences aren't that great this is why I zoomed into the center (see below).
 Most of the cross-connections show how these individuals are distantly related to each other.

Dodecad K12b visualization:

I used the same visualization method (ReticulateNetwork (EqualAngle180) from SplitsTree) for the adjusted distances of Dodecad K12b ADMIXTURE results. The goal is to compare the approach presented above with ADMIXTURE Euclidean distances.


ADMIXTURE is "annotating" and grouping the SNPs into a defined number of components and then it compares the components, not the SNPs themselves. Thus, ADMIXTURE cannot "see" shared DNA segments==> ADMIXTURE does not pick up that KD011 and KD012 are closely related; it also does not pick up that KD010 and KD014 are closely related.
However, ADMIXTURE can "see" overall similarities in the genome and can group based on that. Again, people Alevi Kurmanji and Zazas are the closest to the root of the network of the Kurds. 

Thursday, August 2, 2012

Anatolian Turks

I had some discussions about how the typical Balkan Turk and later how the typical Anatolian Turk would look like. Since the detailed ancestry of most tested Turks is unknown I was looking into other sources and methods. Onur, one of the readers of my blog help me by mentioning:
"Most Dodecad Turks are exclusively from Anatolia, as is clear from the fact that most of them fall in exclusively Anatolian clusters in cluster analyses. BTW, the Behar et al. 2010 Turkish samples are exclusively from the region of Anatolia historically called Cappadocia"
So, I took at the corresponding infromation in the Dodecad project, the ChromoPainter/FineSTRUCTURE analysis of Balkans/West Asia.

The analysis revealed 25 "populations" in the data set (pop0-pop24), two of them are the most interesting for now:
Dienekes wrote:
  • pop10 is Turkish, and includes people with some ancestry from the Balkans, as well as Anatolia. It could be labeled "Balkan Turkish"
  • pop13 is also Turkish, and seems to include people with ancestry exclusively from Anatolia, including almost all the Behar et al. Turks
The great thing is that Dienekes also published the K12b Admixture components of pop10 and pop13. This is can help us to find the best candidate for Anatolian Turks. I also included K12b results of Turks from Hodoğlugil & Mahley (2012).  So, I calculated the TOP30 closest matches for pop10 (Balkan-Anatolian Turkish) and pop13 (Anatolian Turkish).

Top30 matches for pop10 (Balkan-Anatolian Turkish):

 Top30 matches for pop13 (Anatolian Turkish):
Please note that pop10 does not have a lot of good matches, in fact, match#30 (DOD320; adjusted distance: 5.6) of pop13 list is a better match than match#5 (DOD764; adjusted distance: 6.1) of pop10 list. Thus a lot of the lower matches (#14-#30) in pop10 list are not Turks.

The best match for pop10 (Balkan-Anatolian Turkish) of the Dodecad participants is DOD435.
The best match for pop13 (Anatolian Turkish) of the Dodecad participants is DOD433.

Update:

A Top30 list for pop22 was requested.

Dienekes described pop22 as:
  • pop22 could be labeled "Northeastern Anatolia" or (more classically) "Pontus-Colchis". It appears to unite various individuals from Northeastern Turkey and neighboring Georgia, having Karadeniz Turkish, Armenian, Pontic Greek, and Kartvelian ancestry. I strongly encourage participants from this region to join the Project, especially Pontic Greeks, as there are no 100% Pontic Greeks currently in the Project. 
Top30 matches for pop22 (Northeastern Anatolia):

This pop22 is very Armenian (highlighted in yellow), the few non-Armenians in the list are mostly Turkish (highlighted in blue), DOD049 is known to be 1/2 Laz.

The best match for pop22 of the Turkish Dodecad participants is DOD287.

Wednesday, August 1, 2012

mtDNA haplogroup U7

Today, I want show some data about mtDNA haplogroup U7 because U7 is found in high frequencies in Iranic people  including Kurds from Iran. Additionally, I started to use different methods to show how these groups are related to each other.

The current scientific database (Genbank) has 28 fully sequenced U7's, presented here (using CLUSTALW)


The same U7 mtDNA data in a Phylogram:

The same U7 mtDNA data in a Cladogram:

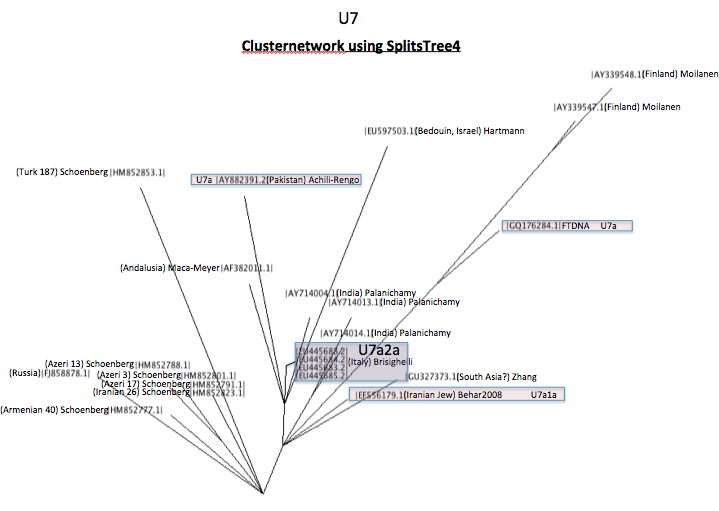
The same U7 mtDNA data in ClusterNetwork:

The same U7 mtDNA data in ConvexHull:

 Either way, the mtDNA haplogroup U7 of Kurdish individuals (not fully sequenced) most likely belongs to the same cluster as the Armenian, the Azeris, and the Iranian. The Turkish and Russian individuals somehow belong to this cluster. Mutations that occur in at least two individuals of this cluster are G143A, T146C, T195C, T310C, T6221C, C12063T, A14047N, A15322G, T16126C, and C16148T. C151T is another typical mutation for this cluster but it is found in the Bedouin, the Iranian Jew, and in samples of South Asia. It almost seems like C151T is the ancestral haplotype and 151C is an old mutation on the early stages of U7.


So, let's see where we can find U7 individuals with these Middle Eastern mutations.

The FTDNA U7 Haplogroup Project has 69 individuals with mtDNA haplogroup U7
1. G143A was found in one individual from Turkey (184281). This individual also has the T146C and the T16126C mutation. This combination was also seen in HM852791(Azeri 17) and HM852823(Iranian 26), however, with an additional T195C mutation, which is lacking in the Turkish individual. FTDNA labeled this individual as U7a4.
2.  The individuals N68725 [Russia, Konakovo (Tver region)] and 130444 [Leah Tatlock 1824-1887 North Carolina] have the T16126C and C16148T, and the T195C mutation. FTDNA labeled these individuals as U7a4 as well.
3. The individual 161466 (Circassian of Northern Caucasus Mtns) has all the private mutations that only occurred in HM852853(Turk187) Schoenberg. They are identical based on the currently tested mutations. FTDNA labeled the individual 161466 as U7a.
4. The individuals N96539 [ Punjabi (Lahore)], N12921 (India) and N12396 (Nicolosi, Dagata, Italy) have the same T16093C that was described in AY714004(India), Palanichamy. The same mutation was also seen in the Assyrian 62118 (Jacob) from the Assyrian Heritage DNA Project.
5. A lot individuals from all over the world seem to have the C151T mutation.  This includes the individuals named above and a lot of more:
4049,
130441 ( Hudie Moschel b.c. 1820 Zalipie, Ukraine; U7a),
94738 Tillekeratne (unknown European origin; U7),
223275,
N31946 (Francesca Borg ab. 1872-1940, Malta),
N62232 (need earliest known maternal ancestor info),
189085 (Manglaben Thaker d.1980, India), 138807 ( Unknown),
156252 (need earliest known maternal ancestor info; U7a),
94467 (Cyrla Moskowicz, Poland),
N34983 (Johanna Greenwald, b 1846, Bielefeld, Germany),
158177 (Ukraine),
136319 (Liza Shafran, born Bobryisk, Belarus in 1941),
N44575 (Bella Glezer, Belarus),
59953 (Fredia Elias, b.c.1824, Kepno, Kaliz, Poland)
51408 (Roschen Cohen, Hamburg, Germany, late 1700's)
C151T can be found in the Middle East, South India and Europe.

The FTDNA Finland DNA project has 3 individuals with mtDNA haplogroup U7
N28814 Finland, Hailuoto
E11886 Margaretha Pehrsdt Koivu, 1671-1766, Haapavesi
75837 Susanna Henrikintytär,1696-1785,Kalajoki,Finland
All three have the Finnish specific A16166- deletion. The individuals E11886 and 75837 have additional information about HVR2 mutations and both show the Finnish specific 291.1A mutation, just like the GenBank data of GQ176284 and AY339548 from Finland. None of them has the U7 Middle Eastern mutations.


The FTDNA Scottich DNA project has one individual with mtDNA haplogroup U7
199889  Douglas  Lettie Jane Ward, 1898-1991
This individual mtDNA is closest to EU597503 (Bedouin,Israel) with the same mutations (309.1C, 315.1C, C522-, A523- and especially G16129A).